How to craft a Data Analyst resume 2025 — guide, templates and examples.
So you're a Data Analyst and you're searching for your next career opportunity? Great, this is a huge step!
First things first, you are going to need a solid Data Analyst resume. One that captures recruiters' attention, positions your unique value and gets your job offers. But how do you craft one of these resumes?
Don't worry. We got you. In this article, we will go into detail about how to craft your Data Analyst — including what to include in your resume and specific examples.
Whether this is your 1st or 10th Data Analyst resume, we got lots of helpful and actionable information for you. At the end of the article, we even have a resume template that you can use to get started!
Ready? Let's do this.
Why is a resume important?
Imagine this: you’re a recruiter hiring for a Data Analyst role. You post the job on LinkedIn or Indeed, and within a week, you’ve got over 1,000 applications in your inbox.
How do you decide who to interview?
It all comes down to the resume.
Studies show that recruiters spend an average of 7.4 seconds looking at each resume. That's it. That’s all the time you have to get their attention.
Your resume is not just piece of paper; it’s a marketing tool. It’s like your personal ad. In most cases, it is the one and only thing they’ll see about you before deciding whether you move forward in the application process.
That’s why your resume needs to be perfect (or close to it).
What are the components of a good Data Analyst resume?
A good Data Analyst resume does these two things:
Shows why you are an ideal candidate for the job
Highlights your unique value proposition as a Data Analyst
On that note, two of the most common mistakes Data Analysts make with their resume:
Listing irrelevant skills. Most job postings literally tell you what they're looking for. The job description is a cheat sheet on how to get the job: use it to tailor your resume.
Being too generic. Remember that recruiter reviewing 1,000 resumes from earlier? You know what will NOT grab their attention? A generic resume. Because why should they pick your resume if it looks just like the others? Instead, be sure to highlight what is unique about YOU and your experience.
If you don't know what makes you unique, spend time thinking through these questions:
Have you won any awards or competitions?
Do you have any publications?
What domain expertise (from past work experience) do you have?
Have you been a speaker at meetups or conferences?
Do you have experience working with C-suite or executives?
Have you mentored junior analysts or lead projects?
All of these are important to mention in your resume! Because they will make you stand out from the crowd.
Resume formatting tips
Before we dive into the details of a Data Analyst resume, let's get the basics right. Here is what works best for a professional resume, like a Data Analyst resume:
Keep it black and white. Clean, minimal, and professional. No need for colors or fancy designs.
Use a single-column layout. It’s easier to read and ATS-friendly (more on this later).
Stick to one page. The exception to this rule is if you have 10+ years of experience in Data Analytics. If so, it's okay to have a 2-page resume.
No photos. You’re applying for a job. What you look like does not (or should not) matter.
No spelling or grammar errors — please. Feed your resume into ChatGPT and ask it to identify any spelling or grammatical errors. It's as simple as that.
Btw, we have included a resume template that follows all of these rules below. Check it out!
What are the key skills that recruiters and hiring managers are looking for?
As mentioned earlier, we want our Data Analyst resume to be customized for the jobs that we are applying for. However, there are key Data Analyst skills that are required for most jobs.
To this end, we did an analysis of the open Data Analyst roles in 2025. This allowed us to identify the most in-demand skills for Data Analysts in 2025. Here they are:
SQL
Communication skills
A data visualization tool (e.g. Tableau)
Excel
Python
Problem-solving skills
Reporting skills
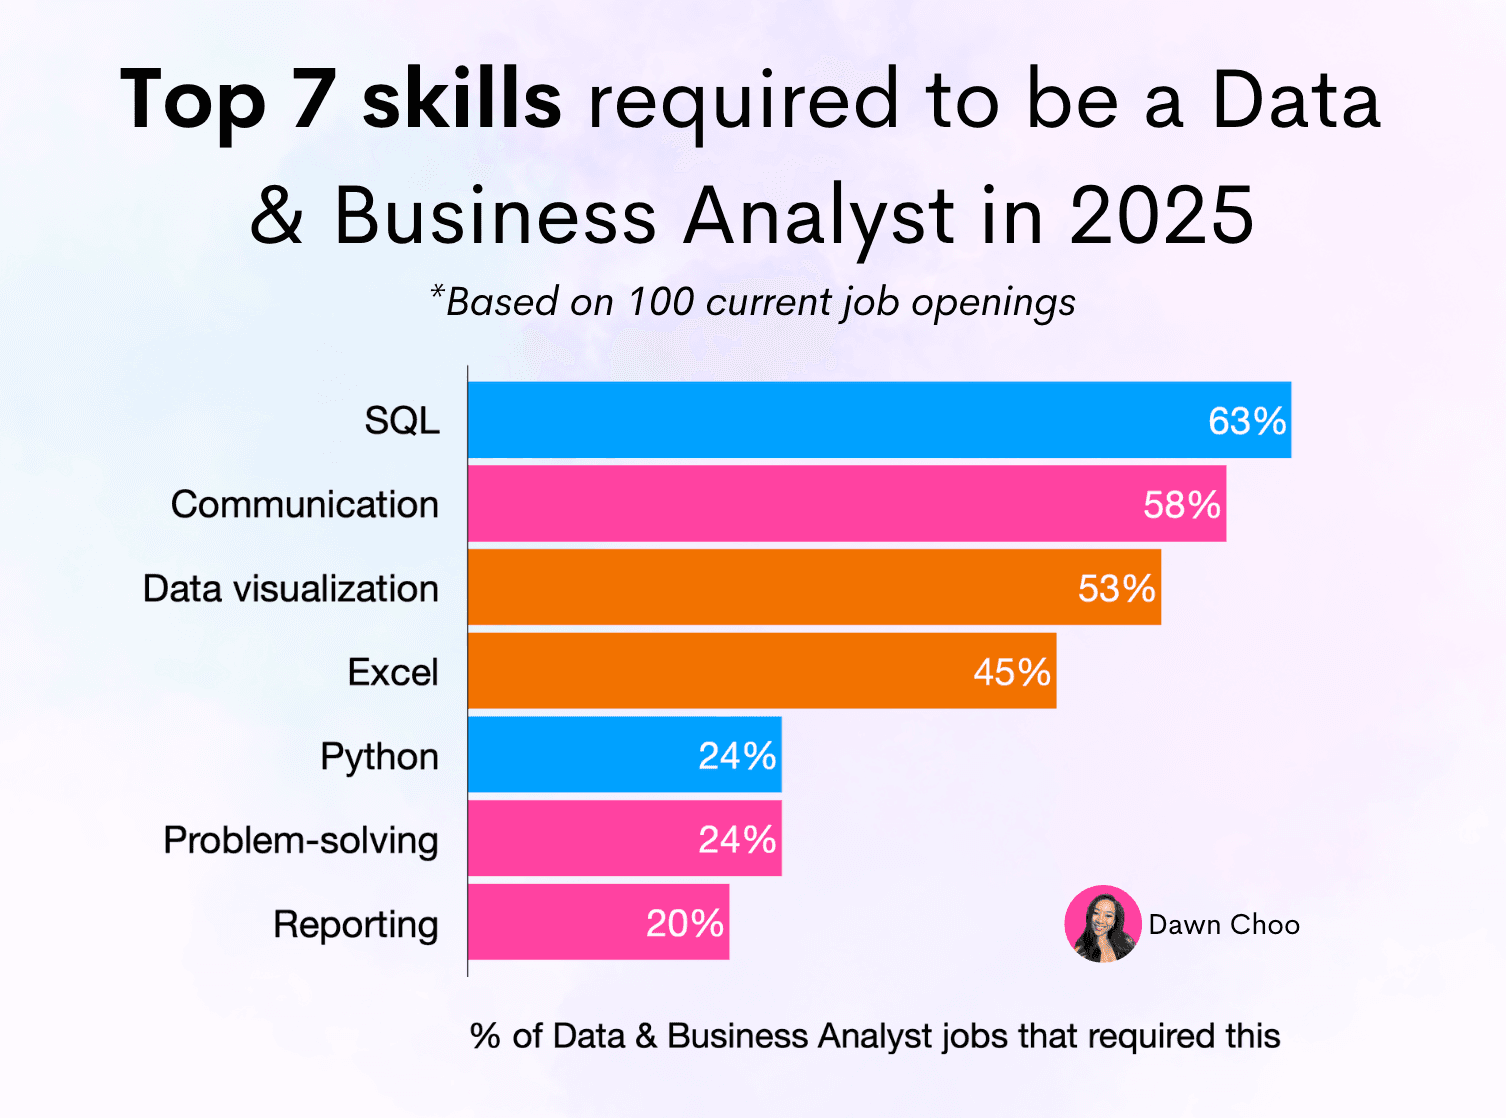
Top Data Analyst Skills in 2025
Simply put, these are the most important skills to showcase on your Data Analyst resume.
Need examples on how to showcase each of these skills? Don't worry, we got you.
Examples on how to showcase SQL:
"Wrote and optimized SQL queries across 12+ normalized tables to generate weekly KPI dashboards for the marketing team, reducing manual reporting time by 60%."
"Joined customer, transaction, and event datasets using complex SQL logic to identify drop-off points in the user funnel, which led to a 15% improvement in conversion."
"Migrated 5 legacy reporting pipelines from Excel to SQL-based scripts, enabling automated refreshes and improving data accuracy."
By the way, want to brush up your SQL interview skills. Check out www.InterviewMaster.AI to get started for free!
Examples on how to showcase Communication skills:
"Presented monthly analytics findings to cross-functional stakeholders, translating technical insights into business recommendations that influenced $500K in budget allocation."
"Partnered with Product Managers to define metrics for a new feature launch, ensuring alignment between data tracking and business goals."
"Led data onboarding sessions for 10+ new hires, explaining internal datasets and tools in non-technical terms."
Examples on how to showcase Data Visualization skills:
"Built and maintained a Tableau dashboard tracking retention and churn for over 200K users, used weekly by the executive team."
"Designed an interactive Power BI report for the operations team, reducing ad-hoc data requests by 40%."
"Created a series of visualizations in Seaborn and Matplotlib to analyze A/B test results for a school capstone project, which won “Best Project” in a cohort of 60 students."
Examples on how to showcase Excel skills:
"Developed a dynamic Excel model with pivot tables and VLOOKUPs to analyze sales performance by region, enabling quarterly forecasting."
"Automated monthly financial reports using nested formulas and macros, reducing reporting time by 8 hours/month."
"Cleaned and structured raw survey data (10,000+ rows) using Excel Power Query, saving the team from manual cleanup work."
Examples on how to showcase Python skills:
"Built a data cleaning pipeline in Python (Pandas + NumPy) to prep 1M+ rows of transaction data for analysis, improving processing time by 70%."
"Developed a regression model in scikit-learn to predict customer lifetime value, increasing marketing ROI by 12%."
"Scraped and parsed competitor pricing data using BeautifulSoup and automated alerts using Python scripts."
Examples on how to showcase Problem-solving skills:
"Identified a data mismatch issue between marketing and product databases, traced it to inconsistent user ID mapping, and led a fix that improved attribution accuracy by 20%."
"Conducted root cause analysis for a drop in app engagement using cohort analysis and funnel metrics, leading to a UX redesign."
"Rebuilt a broken Excel dashboard from scratch under tight deadlines, delivering it 2 days early with added insights not included in the original."
Examples on how to showcase Reporting skills:
"Created and maintained weekly reports tracking campaign performance across 5 channels, distributed to 6 stakeholder teams."
"Designed a reporting suite in Google Data Studio that auto-updated from BigQuery, providing real-time insights to the growth team."
"Compiled a 20-page quarterly data report with narrative insights and visualizations for the VP of Product, informing roadmap prioritization."
The importance of demonstrating impact
As you might notice from the examples above, most of these bullet points are accompanied by some numbers or impact.
Why is this so? Because it's critical to be able to articulate the outcome of our work... What changed because of your analysis? How did the business pivot because of your deep-dive? What processes improved because of your report?
Managers hire for impact. They want to know you’ve done meaningful work before. It's not about the complexity of the queries you've written or the number of charts you've made. It's the outcome that they're interested in. Make sense?
There are two main ways to quantify impact in your resume:
1. Outcome-based impact This shows how your work changed a business metric or strategy. For example:
Increased revenue by 10%
Reduced churn by 5%
Influenced a strategic decision
2. Scope-based impact This is about scale. Even if the outcome isn’t known or measurable, you can show the size of the work you handled:
Worked with 10M+ rows of data
Joined 6 databases across 3 data sources
Supported 5 product teams with weekly reporting
Pro tip: Where possible, size the outcome-based impact. If you can say your analysis helped increase revenue by $250K or reduced processing time by 30%, do that. If that’s not available (we get it, sometimes you don’t have the final business result), scope-based sizing is totally okay too.
What is an ATS and why does it matter?
You might have heard the term ATS thrown around. If not, no worries, let us explain. ATS stands for Applicant Tracking System — it's the software that most companies use to manage job applications.
When you apply for a role online, it typically gets filtered through an ATS system first, before getting passed on to a real human.
What does the ATS do? It scans your resume to check if it matches the job description. The ATS is a black box, but generally what it does is it searches for keywords, job titles, skills and experience.
This is why ATS optimization is important. To increase your chances of getting noticed, you should:
Use clear, keyword-focused job titles and skills
Avoid images, columns, or graphics that can confuse the system
Submit your resume as a PDF (unless the job description says otherwise)
That said, do NOT over optimize for ATS and forget that a human is also going to read your resume. Ultimately, it's the human (recruiter) that is the gatekeeper of interviews.
You need to get past the ATS, but you need to impress the human.
What sections should your resume have?
Alright, now you're ready to start putting together your resume. But what sections should actually go in your resume?
Here is a breakdown of the common resume sections, and whether they’re must-haves or nice-to-haves. In the next sections, we'll go into each of these sections in detail.
Summary section – Highly recommendedA quick 3-4 sentence snapshot of who you are and what past achievements are most relevant and most impactful.
Professional experience – Must have This is the meat of your resume that showcases relevant past professional work. Showcase your most relevant roles and the impact you made.
Education – Must have Especially important if you're early in your career or pivoting into the Data Analytics career.
Projects – Optional Great for showcasing hands-on skills, especially if you're light on work experience.
Community involvement – Optional Use this if you’ve contributed to open-source, organized events, or done volunteer work. We recommend including this if you're applying mission-driven companies.
Fun facts – Optional Adds personality and makes you more memorable. Just make sure it doesn’t use up space you need elsewhere, so keep this to one line max.
Remember... all of this needs to fit into one page. So prioritize the sections that best highlight your strengths and fit the role you’re applying for.
What to include in each resume section
Now that you know what makes a great Data Analyst resume — and which skills to highlight — let’s break it down section by section.
Each part of your resume has a specific purpose, and we’ll show you exactly what to include (and what to leave out) so you can make the most of every inch of space.
At a high level, these are the sections to include on your resume and how much space they should take up:
Summary section – 10–15% A quick highlight reel of your experience, strengths, and why you're a great fit for the role.
Professional Experience – 40–60% The most important section. Focus on relevant roles, achievements, and quantified impact.
Education – 10–15% Include degrees, relevant coursework, and certifications if applicable.
Projects – 10–20% (especially for early-career applicants) Showcase 2–3 relevant projects that demonstrate your technical and problem-solving skills.
Fun Facts or Community Involvement – 1 line maxOptional, but adds personality and helps you stand out as a human.
What to include in the summary section
The summary section is arguably the most important section in your resume. This is the first impression that a recruiter, hiring manager or interviewer has of you. Make this count.
Think about the summary section like a mini cover letter. It should highlight YOUR unique value, and, at the same time, explain why you are the ideal candidate for the job.
We recommend using this 4 line format in your resume:
Line 1 of summary: Overview
This line should mention your role, years of experience, tool specializations and domain expertise.
Example: "I’m a Data Analyst with 3+ years of experience in SQL and Tableau, specializing in Marketing for eCommerce."
Line 2 of summary: Why you are interested in this company or industry
This is the one line you have to update for each company that you're applying. It should take max 5 minutes per job application, and it's a worthy investment. It grabs the recruiters attention by showing why you are interested in that particular company.
Example: "I’m excited about the opportunity to work at a mission-driven company like XYZ that’s using data to drive sustainable growth in the e-commerce space."
Line 3 of summary: One specific, quantified impact you’ve made
Pick the most impactful project from past experience (making sure it is relevant to the job description). Add that into your summary section to immediately highlight your value.
Example: "In my last role, I built a customer segmentation model that helped reduce churn by 12%, saving the company an estimated $200K annually."
Line 4 of summary: One more thing that is unique to you
Like awards, leadership / mentorship experience or publications
Example: "Outside of work, I’ve spoken at two analytics meetups and mentored five junior analysts through an internal training program."
Putting it all together. This is what your summary section would look like:
I’m a Data Analyst with 3+ years of experience in SQL and Tableau, specializing in Marketing for eCommerce. I’m excited about the opportunity to work at a mission-driven company like XYZ that’s using data to drive sustainable growth in the e-commerce space. In my last role, I built a customer segmentation model that helped reduce churn by 12%, saving the company an estimated $200K annually. Outside of work, I’ve spoken at two analytics meetups and mentored five junior analysts through an internal training program.
Notice how this summary section is completely unique to you. It shows off why you are special.
If you aren't sure if your summary passes the "uniqueness" test, try this quick thought exercise. Could another candidate copy-paste your summary and have it still make sense? If yes, it’s not specific enough. Go back, plug in YOUR accomplishments, and make it uniquely you.
What to include in the professional section
This section is the meat of your resume. It should take up about 40-60% of the page.
Include all your relevant past work experience — including full-time roles, internships, and even part-time jobs, if they’re relevant. Even if the title isn’t a perfect match for the role you’re applying to, include it if you gained skills or worked on projects that align with the job.
For example, if you previously worked in a Sales Operations role, but spent some time building out analytics tools. This experience would be interesting to the recruiter and hiring manager, so it belongs on your resume.
Each role that you include on your resume should include these details:
Company name
Job title
Dates of employment
3–8 bullet points highlighting your most relevant achievements and responsibilities
Always list your most recent experience first and work backward (i.e. reverse chronological order.)
Customize your experience to the job description
Now here’s where it gets important: tailor your experience to the job that you're applying to. This means:
Reordering your bullet points to match what the company is looking for – most relevant bullet point should be first
Using similar keywords or phrases from the job post (this helps with both ATS and the human reader)
Highlighting the tools, projects, or industries that are mentioned in the posting
Pro-tips on writing a stellar professional section:
Include a mix of technical skills and soft skills, but focus more on the technical. A good rule of thumb for Data Analyst resumes: 70–80% technical skills, 20–30% soft skills
Don’t forget to quantify your impact (see the earlier section on The Importance of Quantifying Impact). Use impact metrics when you can (eg. increased revenue by $200k), and scope metrics (e.g. worked with 15 data sources) when you can’t.
If you've been promoted, show it off! Promotions show that you're good at your job. List each title separately under the same company, and highlight how your responsibilities increased between the roles.
What to include in the education section
The education section should be short and clear to the point. Typically, this should only take up 10-15% of your resume.
Here is how to structure it:
List your highest level of education first. If you have a Master’s degree, that goes on top. If not, start with your Bachelor’s.
Include the basics: Degree, major, school name, and graduation year.Example: B.S. in Statistics, University of XYZ, 2021
Add relevant coursework (optional, mostly for early-career analysts) Only include courses if they directly relate to the role — things like SQL, data visualization, or statistical modeling.
Mention honors or GPA, if it's strong
Include relevant certifications Certifications like Google Data Analytics, Tableau, or SQL training can go here
Recommendation on where to put your education section:
If you're less than 2 years out of school, your Education section should go above your Professional Experience section because you likely don't have much relevant work experience yet.
If you're more than 2 years out of school, put your Professional Experience before Education. By this point, your work accomplishments carry more weight with recruiters and hiring managers.
What to include in the projects section
This section is especially helpful if you're looking for your first or second Data Analyst job. The goal here is to show that, even if you don’t have extensive work experience yet, you can do the work.
It’s also a great way to demonstrate fit for niche roles. For example, if you’re applying for a Marketing Data Analyst position, highlight projects that involve marketing data. That kind of relevance shows you understand the domain and can hit the ground running.
You might have 10 projects on your portfolio. This is great! Portfolios are a good way to polish your skills and demonstrate your abilities.
But on your resume, stick to showcasing just 2–3 projects that are most relevant to the role you're applying for.
For example if you're applying to a Data Analyst role, you might not need to show off a Deep Learning project. Or if you're applying for a Healthcare Data Analyst role, no need to include your finance dashboard project.
Again, the space on your resume is precious. Include only what is relevant for the roles that you are applying to.
What to include for Each Project
Keep it short and direct. Each project should include:
Project title
1–3 bullet points max:
One line describing the tools & techniques you used
One or two lines describing the business question and insights/recommendations
💡 If possible, quantify the result — even if it’s hypothetical or based on simulated data.
Example:Churn Analysis for E-commerce Customers
Used SQL and Python (Pandas, Matplotlib) to analyze customer churn across a 50K-row dataset.
Identified that high churn was correlated with delayed shipping times and recommended improvements that would reduce churn by an estimated 10%.
Treat this project section like a teaser — your goal is to spark interest, not share every detail of your process. Include a link to your portfolio site where recruiters or hiring managers can explore your projects in more depth.
We will discuss how to build a Data portfolio in a future article.
What to include in the fun facts section
This section is completely optional, but we personally love including it on our resumes.
The idea behind this is to show who you are outside Data. You want to give interviewers a glimpse of your personality and a chance to connect with you as a human.
Use this space to share something unique, interesting, or just plain fun about yourself. It doesn’t need to be data-related at all. Some of our favorite examples:
Ran a 100km ultra-marathon
Building a tiny home from scratch by watching YouTube videos
Creator of a TikTok cooking channel with 10K+ followers
Have fun with this section! Use it to help the hiring manager see you as the kind of coworker they'd be excited to grab lunch with — or survive a flight delay with. Share something interesting about yourself that has nothing to do with data or work.
If you choose to include a Fun Facts section, keep it super short. It should take up 1 line at the bottom of your resume.
Data Analyst Resume Template
Need a place to start? Use our free Data Analyst resume template as your starting point. It’s designed to be ATS-friendly, easy to customize, and focused on what actually matters.
Click the link below to download the template and make it your own!
Get the FREE Data Analyst template now
Data Analyst Resume Checklist
Phew that was a lot of information.
But don't worry, we summarized everything we talked about into a checklist below. Go through this to make sure your resume is ready to impress the ATS and the human reader!
🔲 Is my resume only one page long? Have I used simple section headers and a single column?
🔲 Is my resume free of spelling, punctuation and grammatical errors?
🔲 Does my summary tell a compelling story that highlights my experience, interest in the company, and quantified impact?
🔲 Have I tailored my resume to match the specific job description? Do I use similar language, tools, and keywords?
🔲 Have I clearly showcased core Data Analyst skills like SQL, Excel, and Data Visualization?
🔲 Do most of my bullet points show impact or results? Am I explaining what changed because of my work?
🔲 Have I included 2–3 relevant projects (if early in my career) that show I can do the job?
🔲 Have I quantified my work with real numbers or scope (like % changes, dollar impacts, or data size)?
🔲 Am I showing off any promotions that I have received?
🔲 Did I include a short, personal fun fact to help me stand out — if I have space?
One last note — it's perfectly fine if your resume is not perfect on your first try. Get feedback from your network, and keep iterating on it. You got this!
The #1 most important skill for every Data Analyst is SQL. Brush up on your SQL skills at www.InterviewMaster.AI!